Extreme Weather, Global Warming, Destroying the Earth, Geology, Earthquake America, Earthquake Japan
Showing posts with label Global Warming. Show all posts
Monday, March 11, 2013
Global Warming Pushing Trees North: The Evidence
Discovery News - As the planet warms, the Arctic is feeling the heat. Trees and shrubs are taking hold on what was once tundra, like this young pine and surrounding shrubs in Norway's Arctic Finnmark.
A new international study of the satellite record of greening landscape shows that the places which were firmly Arctic in climate during the mid-20th century are now transforming into evergreen forest lands. If the trend continues, by the end of this century northern Sweden could get the temperatures more common to southern France and northernmost Canada could be more like Montana. Read More
Tuesday, March 5, 2013
Ships to sail directly over the north pole by 2050, scientists say
Melting sea ice will allow ice-strengthened vessels to sail directly over the pole, and normal ships to take the 'northern sea route'
Ships should be able to sail directly over the north pole by the middle of this century, considerably reducing the costs of trade between Europe and China but posing new economic, strategic and environmental challenges for governments, according to scientists.
The dramatic reduction in the thickness and extent of late summer sea ice that has taken place in each of the last seven years has already made it possible for some ice-strengthened ships to travel across the north of Russia via the "northern sea route". Last year a total of 46 ships made the trans-Arctic passage, mostly escorted at considerable cost by Russian icebreakers.
But by 2050, say Laurence C. Smith and Scott R. Stephenson at the University of California in the journal PNAS on Monday, ordinary vessels should be able to travel easily along the northern sea route, and moderately ice-strengthened ships should be able to take the shortest possible route between the Pacific and Atlantic Oceans, passing over the pole itself. The easiest time would be in September, when annual sea ice cover in the Arctic Ocean is at its lowest extent. Read More
Ships should be able to sail directly over the north pole by the middle of this century, considerably reducing the costs of trade between Europe and China but posing new economic, strategic and environmental challenges for governments, according to scientists.
The dramatic reduction in the thickness and extent of late summer sea ice that has taken place in each of the last seven years has already made it possible for some ice-strengthened ships to travel across the north of Russia via the "northern sea route". Last year a total of 46 ships made the trans-Arctic passage, mostly escorted at considerable cost by Russian icebreakers.
But by 2050, say Laurence C. Smith and Scott R. Stephenson at the University of California in the journal PNAS on Monday, ordinary vessels should be able to travel easily along the northern sea route, and moderately ice-strengthened ships should be able to take the shortest possible route between the Pacific and Atlantic Oceans, passing over the pole itself. The easiest time would be in September, when annual sea ice cover in the Arctic Ocean is at its lowest extent. Read More
Thursday, January 24, 2013
New ice core data from Greenland offers chilling clues about the direction of Earth’s climate
‘Our kids and grandkids are definitely going to look back and shake their heads at the inaction of this country’s generation’
By Summit Voice
FRISCO — Last summer’s unusual melting at the surface of Greenland’s ice cap has a historic precedent, but you have to go back more than 100,000 years, to an extremely warm interglacial period of Earth’s history, to find it, according to an international science team’s analysis of ice core samples spanning millennia of climate history.
The new study, published this week in Nature, offers clues about where the planet is headed in terms of increasing greenhouse gases and rising temperatures, according to CU-Boulder ice core expert Jim White — another researcher whose detailed knowledge of climate science has led him to advocate for reductions in greenhouse gas emissions.
“Unfortunately, we have reached a point where there is so much carbon dioxide in the atmosphere it’s going to be difficult for us to further limit our impact on the planet,” White said. “Our kids and grandkids are definitely going to look back and shake their heads at the inaction of this country’s generation. We are burning the lion’s share of oil and natural gas to benefit our lifestyle, and punting the responsibility for it.”
Increasing amounts of carbon dioxide in the atmosphere from sources like vehicle exhaust and industrial pollution — which have risen from about 280 parts per million at the onset of the Industrial Revolution to 391 parts per million today — are helping to raise temperatures on Earth, with no end in sight, said White. Read More
Monday, January 7, 2013
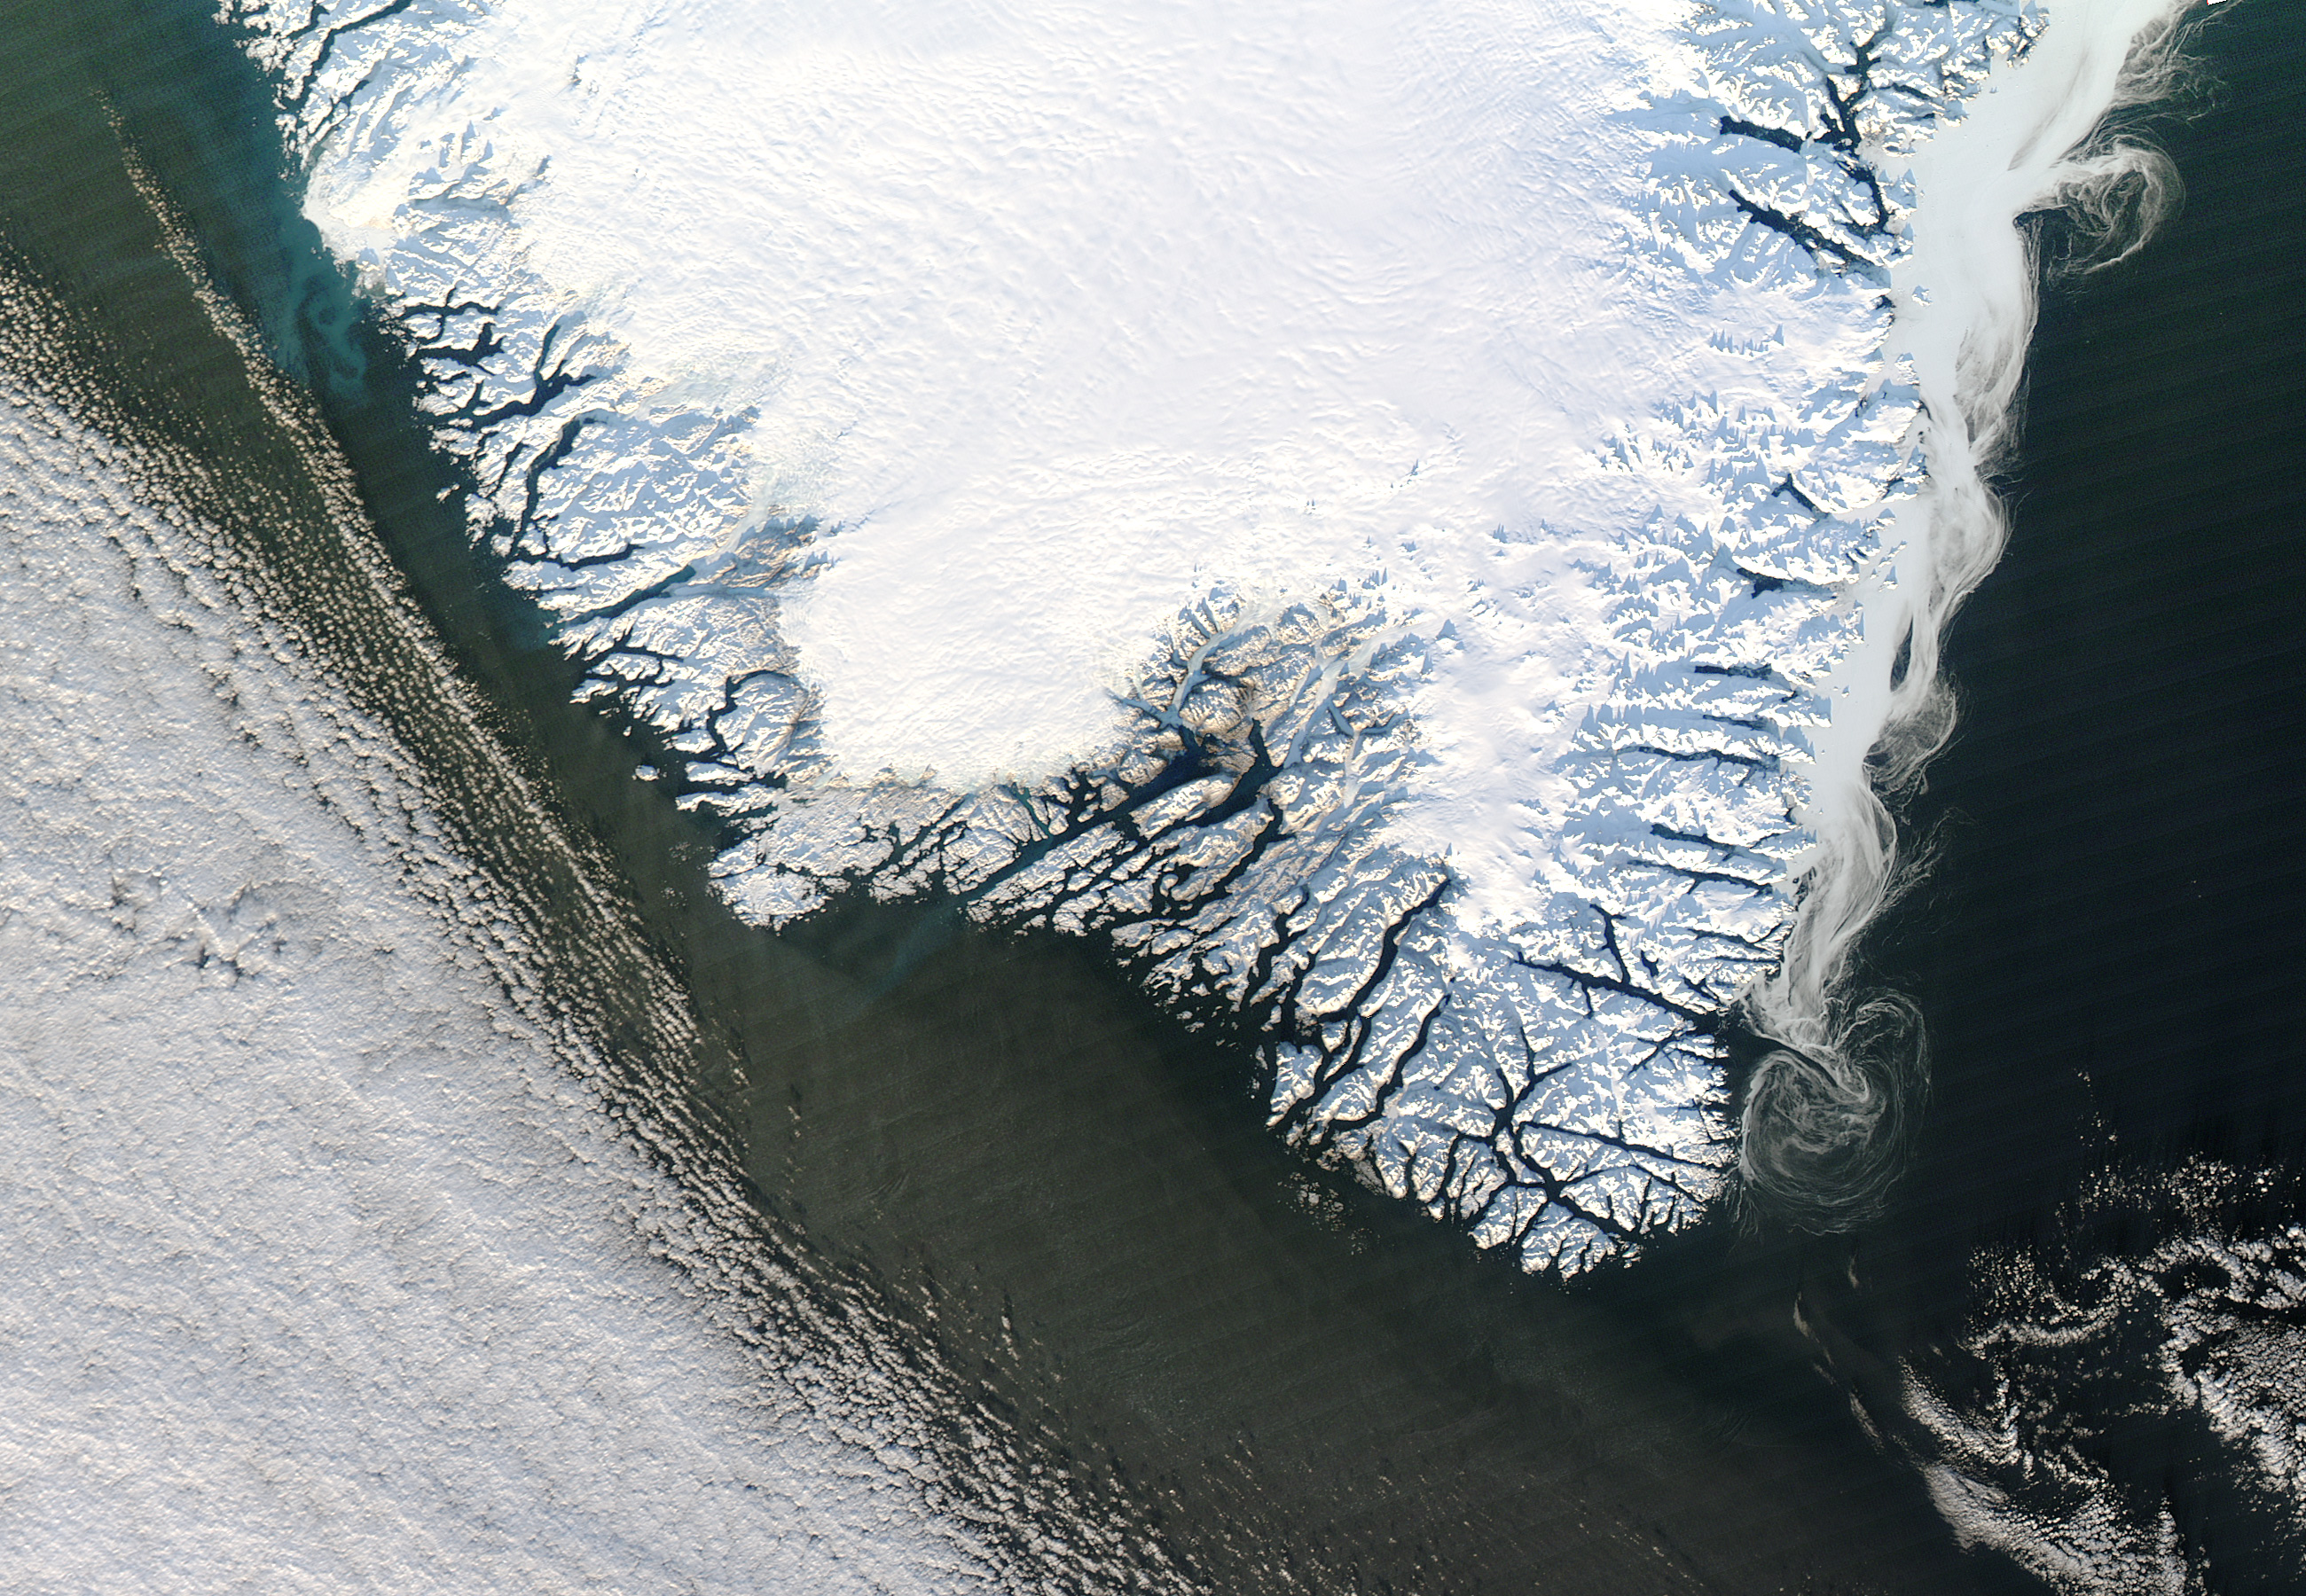
Ice Swirls off the Coast of Greenland…For Now
![]() |
| NASA's Aqua satellite view of ice swirling off the coast of Greenland. |
NASA’s Aqua satellite is one in this fleet, mapping out the entire surface of the Earth—and in particular the water covering our world—every day or two. On December 30, 2012, it took this incredible picture of the southeast coast of Greenland in the late afternoon:
Right now, in the depth of winter, the ice over Greenland and the Arctic is growing. But come March, when temperatures warm, that ice will start to melt. Over the past few years the melting has been larger nearly every year, with the extent (area covered) and volume (total amount) of the ice decreasing rapidly. In late summer 2007 the historical record for lowest sea ice extent was broken, and then in 2011 that record was shattered again. Last year, Greenland experienced a melting season unlike anything that has been seen in a long time; there were unusual conditions that led to this event, such as a large heat wave, but the overall trend is clearly not good. And the reason is very, very clear; global warming, caused by human activity. Read More
Monday, November 19, 2012
California Tackles Climate Change, But Will Others Follow?
Daniel Stone
Can California save the planet?
The state that has instigated every key U.S. effort to curb fossil-fuel emissions since the 1960s now will tackle the greatest challenge of all—reining in greenhouse gases—with a cap-and-trade system launched this week.
In a closed three-hour auction conducted online Wednesday, California's energy companies and large manufacturers placed their bids for 62 million permits that essentially give them the right to pollute. Using these chits and a healthy number of free permits California has allocated them, the businesses begin in January operating in a market-based program that officials hope will cut the state's carbon dioxide emissions by 20 percent over the next eight years. (Related: "Pictures: Nine Surprisingly Gassy Cities")
The aim is ambitious, and for advocates of action on climate change, there is a larger goal still. They are hoping that California will lead the way to the kind of broader action on global warming that has been stymied both in Washington, D.C., and in international negotiations. (Related: "Climate Change Talks Hinge on 'Green Growth,' says De Boer")
"I think this will show that you can decouple economic growth from emissions growth," said Tim O'Connor, director of the Environmental Defense Fund's California Climate Initiative. "We think California will be the best of all examples. This is the strongest and boldest move yet in the U.S. to combat climate change." Read More
The state that has instigated every key U.S. effort to curb fossil-fuel emissions since the 1960s now will tackle the greatest challenge of all—reining in greenhouse gases—with a cap-and-trade system launched this week.
In a closed three-hour auction conducted online Wednesday, California's energy companies and large manufacturers placed their bids for 62 million permits that essentially give them the right to pollute. Using these chits and a healthy number of free permits California has allocated them, the businesses begin in January operating in a market-based program that officials hope will cut the state's carbon dioxide emissions by 20 percent over the next eight years. (Related: "Pictures: Nine Surprisingly Gassy Cities")
The aim is ambitious, and for advocates of action on climate change, there is a larger goal still. They are hoping that California will lead the way to the kind of broader action on global warming that has been stymied both in Washington, D.C., and in international negotiations. (Related: "Climate Change Talks Hinge on 'Green Growth,' says De Boer")
"I think this will show that you can decouple economic growth from emissions growth," said Tim O'Connor, director of the Environmental Defense Fund's California Climate Initiative. "We think California will be the best of all examples. This is the strongest and boldest move yet in the U.S. to combat climate change." Read More
Monday, November 12, 2012
Poles apart: satellites reveal why Antarctic sea ice grows as Arctic melts
![]() |
Two decades of measurements show that changing wind patterns around Antarctica have caused a small increase in sea ice, the result of cold winds off the continent blowing ice away from the coastline.
"Until now these changes in ice drift were only speculated upon using computer models," said Paul Holland at the British Antarctic Survey. "Our study of direct satellite observations shows the complexity of climate change.
"The Arctic is losing sea ice five times faster than the Antarctic is gaining it, so, on average, the Earth is losing sea ice very quickly. There is no inconsistency between our results and global warming."
The extent of sea ice is of global importance because the bright ice reflects sunlight far more than the ocean that melting uncovers, meaning temperature rises still further. Read More
Wednesday, October 31, 2012
Climate change, or crap shoot? Experts weigh Sandy's causes
(Reuters) - A huge storm barrels down on the United States, wreaking havoc with punishing winds, record flooding, heavy snowfall and massive blackouts. Is the main culprit climate change or a freak set of coincidences?
Sandy wiped out homes along the New Jersey shore, submerged parts of New York City, and dumped snow as far south as the Carolinas. At least 50 people were reported killed in the United States, on top of 69 in the Caribbean, while millions of people were left without power.
Some scientists say that the key to Sandy's impact may be an extremely rare clash of weather systems, rather than the warmer temperatures that scientists have identified in other hurricanes and storms.
"It's a hybrid storm, which combines some features of tropical hurricanes with some features of winter storms, that operate on quite different mechanisms," said Kerry Emanuel, a professor of Atmospheric Science at Massachusetts Institute of Technology.
While Emanuel said that there is a clear link between climate change and general trends toward more intense tropical hurricanes, in the case of Sandy more long-term study is required to determine whether climate change played a major role. Read More
Sandy wiped out homes along the New Jersey shore, submerged parts of New York City, and dumped snow as far south as the Carolinas. At least 50 people were reported killed in the United States, on top of 69 in the Caribbean, while millions of people were left without power.
Some scientists say that the key to Sandy's impact may be an extremely rare clash of weather systems, rather than the warmer temperatures that scientists have identified in other hurricanes and storms.
"It's a hybrid storm, which combines some features of tropical hurricanes with some features of winter storms, that operate on quite different mechanisms," said Kerry Emanuel, a professor of Atmospheric Science at Massachusetts Institute of Technology.
While Emanuel said that there is a clear link between climate change and general trends toward more intense tropical hurricanes, in the case of Sandy more long-term study is required to determine whether climate change played a major role. Read More
Monday, August 20, 2012
Hot enough for ya... to stop denyin'?
July 2012 was the hottest month ever recorded in the contiguous United States. During that month, the surface ice in Greenland disappeared so quickly that slackjawed scientists are still scratching their heads over how such a thing could be possible. And Richard Muller, one of the most prominent voices for what may be politely termed climate-change "skepticism" has loudly proclaimed that he was 100% wrong - the planet is indeed warming, he says, and "humans are almost entirely the cause."
Still, as we approach a cliff of no-turning-back finality, there's a distinct lack of public discourse about what needs to happen soon to avoid such a point. Earth to Philly will keep hammering away to help get this message out, but ours is a tiny (and shrill?) voice compared to who we need to hear from: At the very least, Romney and Obama should be making bold policy prescriptions that explicitly address this crisis with urgent foresight. Read More
Sunday, July 15, 2012
NOAA releases comprehensive 2011 State of the Climate report
On Tuesday, July 10, 2012, NOAA released the 2011 State of the Climate report. This report is a peer reviewed paper that was compiled by 378 scientists from 48 countries around the world. This report looks at the extreme weather events that occurred in 2011. It also analyzes global climate indicators and monitoring stations and instruments used on land, sea, ice, and sky. The report says that 2011 was the coolest year on record since 2008, but it remained above the 30-year average (1981-2010). La Nina – the cool phase of the El Niño-Southern Oscillation – was the major cooling factor, globally, in 2011. At the same time, the influence of human-caused global warming on the climate system continues to grow. The report identified “human fingerprints” in more than two dozen climate indicators examined by this international research team — from air temperatures to ocean acidity. More specifics of the report below.
According to NOAA, La Niña played a major role in the crazy weather events that occurred in 2011, such as the violent tornado outbreaks in the United States, severe droughts in southern United States, northern Mexico, and East Africa, and one of the worst summer heat waves in central and southern Europe since 2003. Read More
Wednesday, June 27, 2012
Sea levels on US East Coast rising rapidly: Should residents be worried?
The pace of sea-level rise along a swath of the US East Coast – from north of Boston down to North Carolina's Cape Hatteras – is accelerating three to four times faster than the worldwide average, according to a new study from the US Geological Survey (USGS), turning the region into a hot spot for sea-level rise.
At stake: the increased vulnerability of coastal communities to severe damage from storm surges or even high surf caused by storms off shore.
The prime suspect: global warming, through its direct effect on heating water at the ocean surface as well as the effect warmed seawater and air temperatures can have on speeding the pace at which Greenland is losing ice.
Warmer seawater in the North Atlantic and increasing amounts of fresh water from melting Greenland ice can slow ocean-circulation patterns in the ocean basin, which can trigger the accelerated rise, modeling studies have suggested. Read More
At stake: the increased vulnerability of coastal communities to severe damage from storm surges or even high surf caused by storms off shore.
The prime suspect: global warming, through its direct effect on heating water at the ocean surface as well as the effect warmed seawater and air temperatures can have on speeding the pace at which Greenland is losing ice.
Warmer seawater in the North Atlantic and increasing amounts of fresh water from melting Greenland ice can slow ocean-circulation patterns in the ocean basin, which can trigger the accelerated rise, modeling studies have suggested. Read More
Tuesday, May 29, 2012
Thirty-six years of failure: a brief history of climate change
Doug Craig / Redding.com
In late June of 1988, the United Nations Environmental Program (UNEP), the World Meteorological Organization (WMO) and the government of Canada sponsored "the World Conference on Our Changing Atmosphere: Implications for Global Security".
More than 300 scientists and policy makers from 46 countries attended and released a Conference Statement that said in part, "Humanity is conducting an unintended, uncontrolled, globally pervasive experiment whose ultimate consequences could be second only to a global nuclear war. The Earth's atmosphere is being changed at an unprecedented rate by pollutants resulting from human activities, inefficient and wasteful fossil fuel use and the effects of rapid population growth in many regions."
"The 1988 conference...put climate change on the global agenda and proposed a specific initial target for a global reduction in the emission of greenhouse gases - 20% below 1988 levels by 2005 - on the way to a much larger ultimate reduction, to be set following further research and debate."
To put this into perspective, nine years later, the 1997 Kyoto Protocol that virtually every nation on Earth signed, except for the US, involved a commitment to reduce greenhouse gas emissions by 5 percent below 1990 levels by 2012. Eleven years later, President Obama, in turn, pledged to reduce American emissions 17 percent below 2005 levels by 2020. This could be called goalpost shifting.
It is like a 200 pound man setting a goal to weigh 175 pounds in one year. A year later when he weighs 250 pounds, he sets a goal to weigh 225 pounds in one year. A year later when he weighs 300 pounds, his new goal is to weigh 275 pounds in one year. And so on. Our objective from the beginning appears to have been to set goals, not reach them. And when we fail to reach previous goals, we just set new ones. Anyway, the media and the public have a short memory and barely care. And in an election year, the fate of the planet is low on our list of priorities. Read More
In late June of 1988, the United Nations Environmental Program (UNEP), the World Meteorological Organization (WMO) and the government of Canada sponsored "the World Conference on Our Changing Atmosphere: Implications for Global Security".
More than 300 scientists and policy makers from 46 countries attended and released a Conference Statement that said in part, "Humanity is conducting an unintended, uncontrolled, globally pervasive experiment whose ultimate consequences could be second only to a global nuclear war. The Earth's atmosphere is being changed at an unprecedented rate by pollutants resulting from human activities, inefficient and wasteful fossil fuel use and the effects of rapid population growth in many regions."
"The 1988 conference...put climate change on the global agenda and proposed a specific initial target for a global reduction in the emission of greenhouse gases - 20% below 1988 levels by 2005 - on the way to a much larger ultimate reduction, to be set following further research and debate."
To put this into perspective, nine years later, the 1997 Kyoto Protocol that virtually every nation on Earth signed, except for the US, involved a commitment to reduce greenhouse gas emissions by 5 percent below 1990 levels by 2012. Eleven years later, President Obama, in turn, pledged to reduce American emissions 17 percent below 2005 levels by 2020. This could be called goalpost shifting.
It is like a 200 pound man setting a goal to weigh 175 pounds in one year. A year later when he weighs 250 pounds, he sets a goal to weigh 225 pounds in one year. A year later when he weighs 300 pounds, his new goal is to weigh 275 pounds in one year. And so on. Our objective from the beginning appears to have been to set goals, not reach them. And when we fail to reach previous goals, we just set new ones. Anyway, the media and the public have a short memory and barely care. And in an election year, the fate of the planet is low on our list of priorities. Read More
Friday, April 13, 2012
Antarctic Ice Sheet Collapse Linked To Ancient 'Mega Flood'
by Jennifer Walsh
Dramatic warming at the end of the last ice age produced an intense rise in sea level and a massive ice sheet collapse in the Antarctic.
The sea level rise is known as Melt-Water Pulse 1A, and new research indicates it increased sea level by about 45 feet (14 meters) sometime between 14,650 and 14,310 years ago, during the same time as a period of rapid climate change known as the Bølling warming.
Understanding the impacts of earlier warming and sea-level rise is important for predicting the effects of future warming.
"It is vital that we look into Earth's geological past to understand rare but high-impact events, such as the collapse of giant ice sheets that occurred 14,600 years ago," study researcher Alex Thomas of Oxford University said in a statement. "Our work gives a window onto an extreme event in which deglaciation coincided with a dramatic and rapid rise in global sea levels — an ancient 'mega flood.'"
During this period, "sea level rose more than ten times more quickly than it is rising now," Thomas said, with the rising seas resulting from melting ice sheets that had formed during the ice age. "This is an excellent test bed for climate models: If they can reproduce this extraordinary event, it will improve confidence that they can also predict future change accurately." Read More
Dramatic warming at the end of the last ice age produced an intense rise in sea level and a massive ice sheet collapse in the Antarctic.
The sea level rise is known as Melt-Water Pulse 1A, and new research indicates it increased sea level by about 45 feet (14 meters) sometime between 14,650 and 14,310 years ago, during the same time as a period of rapid climate change known as the Bølling warming.
Understanding the impacts of earlier warming and sea-level rise is important for predicting the effects of future warming.
"It is vital that we look into Earth's geological past to understand rare but high-impact events, such as the collapse of giant ice sheets that occurred 14,600 years ago," study researcher Alex Thomas of Oxford University said in a statement. "Our work gives a window onto an extreme event in which deglaciation coincided with a dramatic and rapid rise in global sea levels — an ancient 'mega flood.'"
During this period, "sea level rose more than ten times more quickly than it is rising now," Thomas said, with the rising seas resulting from melting ice sheets that had formed during the ice age. "This is an excellent test bed for climate models: If they can reproduce this extraordinary event, it will improve confidence that they can also predict future change accurately." Read More
Tuesday, April 3, 2012
Are Ocean Levels And Temperatures On The Rise?
A new study has revealed a global warming and rising of the oceans. Contrasting ocean temperature readings from the 1870s with modern readings, this study reveals an upward rising trend spanning over 100 years.
Dan Roemmich, a Scripps Institution of Oceanography at UC San Diego physical oceanographer led the research. He found a .33 degree Celsius (.59-degree Fahrenheit) increase on average in the top portions of the ocean, down to 700 meters. Ocean surface temperatures, however, saw the largest amount of temperature rise at .59 degrees Celsius (1.1 degree Fahrenheit) and down to .12 degrees Celsius (.22 degree Fahrenheit) at 900 meters.
Roemmich’s study is the first to compare the temperature between the voyage of HMS Challenger (1872-1876) and data from modern day readings conducted by ocean-probing robots. These robots continuously report the ocean’s temperature thanks to the global Argo program. Scientists have long believed 90% of Earth’s excess heat in the climate system since the 1960s has been trapped and stored in the oceans.
Roemmich’s study, however, reports the warming trend began much sooner, as soon as 100 years ago. His report was co-authored by John Gould of the United Kingdom-based National Oceanography Centre and John Gilson of Scripps Oceanography. It was published on April 1, 2012, in an advance online edition of Nature Climate Change.
“The significance of the study is not only that we see a temperature difference that indicates warming on a global scale, but that the magnitude of the temperature change since the 1870s is twice that observed over the past 50 years,” said Roemmich, co-chairman of the International Argo Steering Team. “This implies that the time scale for the warming of the ocean is not just the last 50 years but at least the last 100 years.” Read More
Monday, March 26, 2012
Creating Little Green Men
[...hey, we did it in Atlantis...-L.]
If you thought that the human engineering pseudo-science died out with its Nazi practitioners, think again. The concept is alive and well and being touted as a means to the creation of a human race more in sync with Big Brother’s ideal of a carbon-friendly humanity.
Prof. Matthew Liao of New York University’s Center for Bioethics touts “human engineering” as offering possible solutions to the politically correct green thesis that human beings are becoming a pest threatening the survival of planet Earth. In academic terms his thesis is that “the biomedical modification of humans makes them better at mitigating climate change” (Ethics, Policy and Environment, February 9).
In other words, if we can genetically engineer a species of much smaller human beings, it follows that our environmental footprint on planet Earth will be much smaller and hence the damage we are told we do to planet Earth will be reduced.
Is this guy really serious?
Sadly, it appears he is. He puts his argument this way: “We shall argue that human engineering potentially offers an effective means of tackling climate change …. [A] striking example of human engineering is the possibility of making humans smaller. Human ecological footprints are partly correlated with our size. … [A] more speculative and controversial way of reducing adult height is to reduce birth weight. … [P]harmacologically induced altruism and empathy could increase the likelihood that we adopt the necessary behavioral and market solutions for curbing climate change” (ibid).
Having apparently bought the whole politically correct argument that human beings are planet Earth’s principal pest, heating up the planet at an unacceptably accelerating rate by their general habits of living, Liao posits: “Anthropogenic climate change is arguably one of the biggest problems that confront us today. There is ample evidence that climate change is likely to affect adversely many aspects of life for all people around the world, and that existing solutions such as geoengineering might be too risky and ordinary behavioural and market solutions might not be sufficient to mitigate climate change. Read More
Tuesday, March 6, 2012
Tuesday, February 14, 2012
NASA Mission Takes Stock of Earth’s Melting Land Ice
Written by Alan Buis
NASA’s Jet Propulsion Laboratory
Pasadena, CA – In the first comprehensive satellite study of its kind, a University of Colorado at Boulder-led team used NASA data to calculate how much Earth’s melting land ice is adding to global sea level rise.
Using satellite measurements from the NASA/German Aerospace Center Gravity Recovery and Climate Experiment (GRACE), the researchers measured ice loss in all of Earth’s land ice between 2003 and 2010, with particular emphasis on glaciers and ice caps outside of Greenland and Antarctica.
The total global ice mass lost from Greenland, Antarctica and Earth’s glaciers and ice caps during the study period was about 4.3 trillion tons (1,000 cubic miles), adding about 0.5 inches (12 millimeters) to global sea level. That’s enough ice to cover the United States 1.5 feet (0.5 meters) deep. “Earth is losing a huge amount of ice to the ocean annually, and these new results will help us answer important questions in terms of both sea rise and how the planet’s cold regions are responding to global change,” said University of Colorado Boulder physics professor John Wahr, who helped lead the study. “The strength of GRACE is it sees all the mass in the system, even though its resolution is not high enough to allow us to determine separate contributions from each individual glacier.” Read More
NASA’s Jet Propulsion Laboratory
Pasadena, CA – In the first comprehensive satellite study of its kind, a University of Colorado at Boulder-led team used NASA data to calculate how much Earth’s melting land ice is adding to global sea level rise.
Using satellite measurements from the NASA/German Aerospace Center Gravity Recovery and Climate Experiment (GRACE), the researchers measured ice loss in all of Earth’s land ice between 2003 and 2010, with particular emphasis on glaciers and ice caps outside of Greenland and Antarctica.
The total global ice mass lost from Greenland, Antarctica and Earth’s glaciers and ice caps during the study period was about 4.3 trillion tons (1,000 cubic miles), adding about 0.5 inches (12 millimeters) to global sea level. That’s enough ice to cover the United States 1.5 feet (0.5 meters) deep. “Earth is losing a huge amount of ice to the ocean annually, and these new results will help us answer important questions in terms of both sea rise and how the planet’s cold regions are responding to global change,” said University of Colorado Boulder physics professor John Wahr, who helped lead the study. “The strength of GRACE is it sees all the mass in the system, even though its resolution is not high enough to allow us to determine separate contributions from each individual glacier.” Read More
Tuesday, February 7, 2012
Global Warming Felt in Gardens
Global warming is hitting not just home, but garden. The color-coded map of planting zones often seen on the back of seed packets is being updated by the government, illustrating a hotter 21st century.
It’s the first time since 1990 that the U.S. Department of Agriculture has revised the official guide for the nation’s 80 million gardeners, and much has changed. Nearly entire states, such as Ohio, Nebraska and Texas, are in warmer zones.
The new guide, unveiled Wednesday at the National Arboretum, arrives just as many home gardeners are receiving their seed catalogs and dreaming of lush flower beds in the spring.
It reflects a new reality: The coldest day of the year isn’t as cold as it used to be, so some plants and trees can now survive farther north. Read More
Wednesday, December 14, 2011
NASA: Earth's Prehistoric Record Warns of Nearing Rapid Climate Change
A new U.S. space agency study warns the Earth this century could see rapid and catastrophic climate changes if man-made global warming levels are allowed to reach an internationally-recognized so-called “safe limit” of two degrees Celsius.
The NASA researchers examined prehistoric climate conditions during past interglacial periods - the time between ice ages - and compared them with the interglacial period the Earth is currently experiencing. The last interglacial period ended around 115,000 years ago when temperatures were less than one degree Celsius warmer than today, and sea levels were six meters higher. Read More
Monday, October 31, 2011
Historic October Northeast storm: Epic. Incredible. Downright ridiculous.
By Andrew Freedman
Perhaps no combination of superlatives could do justice to the historic snowstorm that delivered a crippling wallop to parts of the mid-Atlantic and Northeast over the weekend. Widely referred to by its social media moniker, “Snowtober,” the storm smashed records that had stood since the beginning of the reliable instrument record in the late 1800s (and in some cases, even longer than that), and upended assumptions about what a fall nor’easter can do. The heavy, wet snow pasted onto trees still bearing foliage in many areas and weighed down power lines, knocking out power to at least three million people in the region.
The paralyzing storm overturned generations of commonly held wisdom that held that the first big snows don’t normally come before Thanksgiving for most areas, certainly not prior to Halloween. Late last week, as computer models began to lock onto a snowy forecast scenario, many meteorologists (including those of us at CWG) struggled with believing what the computers were projecting, given its unprecedented nature.
Coming in the midst of what is already one of the most extreme years in American weather history, the Snowtober event had a greater impact in some states than August’s much-hyped Tropical Storm Irene. It was the snowstorm, not Irene, which caused the largest power outage in Connecticut history, for example.
To put the storm into its proper meteorological context, consider these snowy facts. The storm brought thundersnow to New York City shortly past lunchtime on Saturday, October 29, before the city had even recorded its first freeze. Central Park received 2.9 inches of snow, with up to six inches falling in the Bronx. This was the only time in recorded history that an inch or more of snow has fallen in Central Park during the month of October. The combination of the heavy, wet snow and high winds damaged or destroyed hundreds of trees in the city. The New York Times reported that up to a thousand trees in Central Park could be lost due to storm-related damage. Read More
(Rolling Stone) Wingnut Watch: October Snow Ends Climate Change Debate It's snowing in October – so, sorry, that pretty much sews up the case against climate change. How could the planet be warming if it's getting colder? Thus, the logic of Fox News Eric Bolling, who tweeted ...
Perhaps no combination of superlatives could do justice to the historic snowstorm that delivered a crippling wallop to parts of the mid-Atlantic and Northeast over the weekend. Widely referred to by its social media moniker, “Snowtober,” the storm smashed records that had stood since the beginning of the reliable instrument record in the late 1800s (and in some cases, even longer than that), and upended assumptions about what a fall nor’easter can do. The heavy, wet snow pasted onto trees still bearing foliage in many areas and weighed down power lines, knocking out power to at least three million people in the region.
The paralyzing storm overturned generations of commonly held wisdom that held that the first big snows don’t normally come before Thanksgiving for most areas, certainly not prior to Halloween. Late last week, as computer models began to lock onto a snowy forecast scenario, many meteorologists (including those of us at CWG) struggled with believing what the computers were projecting, given its unprecedented nature.
Coming in the midst of what is already one of the most extreme years in American weather history, the Snowtober event had a greater impact in some states than August’s much-hyped Tropical Storm Irene. It was the snowstorm, not Irene, which caused the largest power outage in Connecticut history, for example.
To put the storm into its proper meteorological context, consider these snowy facts. The storm brought thundersnow to New York City shortly past lunchtime on Saturday, October 29, before the city had even recorded its first freeze. Central Park received 2.9 inches of snow, with up to six inches falling in the Bronx. This was the only time in recorded history that an inch or more of snow has fallen in Central Park during the month of October. The combination of the heavy, wet snow and high winds damaged or destroyed hundreds of trees in the city. The New York Times reported that up to a thousand trees in Central Park could be lost due to storm-related damage. Read More
(Rolling Stone) Wingnut Watch: October Snow Ends Climate Change Debate It's snowing in October – so, sorry, that pretty much sews up the case against climate change. How could the planet be warming if it's getting colder? Thus, the logic of Fox News Eric Bolling, who tweeted ...
Skeptic’s own study finds climate change real, but says scientists should be more critical
from the Washington Post-A prominent physicist and skeptic of global warming spent two years trying to find out if mainstream climate scientists were wrong. In the end, he determined they were right: Temperatures really are rising rapidly. The study of the world’s surface temperatures by Richard Muller was partially bankrolled by a foundation connected to global warming deniers. He pursued long-held skeptic theories in analyzing the data. He was spurred to action because of “Climategate,” a British scandal involving hacked emails of scientists. Yet he found that the land is 1.6 degrees warmer than in the 1950s. Those numbers from Muller, who works at the University of California, Berkeley and Lawrence Berkeley National Lab, match those by the National Oceanic and Atmospheric Administration and NASA. Read More
Subscribe to:
Posts (Atom)